← Back to case studies The visual studio

The film and the artwork, made in the same room as the system.

Most firms build you a system and hand you a logo. We produce the campaign layer too — brand film with a consistent on-screen presenter, editorial illustration, and data visualisation drawn from real figures. Same studio, same standard, no external agency in the loop.

A note on what you're seeing. These are frames and cuts from live client work. Names, figures and identifying detail have been removed — your work would be handled exactly the same way.

The presenterScene one
On locationScene two
Brand film

One face, every scene, no film crew.

A product film for one of our own systems, produced end to end in-house — written, cast, generated, scored and cut. The same presenter holds across every scene and location, which is the part that usually falls apart.

Consistent talentThe same face, voice and wardrobe across every shot — no drift between scenes.
Real interface overlaysLive product UI composited into the frame, so the film shows the actual thing working.
Sound designedAmbience, effects and score built to picture, not dropped on top of it.
Days, not monthsNo shoot, no crew, no location fees — versioned and re-cut on request.
Illustration & data visualisation

Explaining a complicated argument in one frame.

Built for an industry body that needed to put a technical case in front of decision-makers. The house style is set once, then every frame is generated inside it — and critically, no figure is ever drawn by the model. Numbers, dates and citations are laid on afterwards in code, from the source, so nothing on screen can be invented.
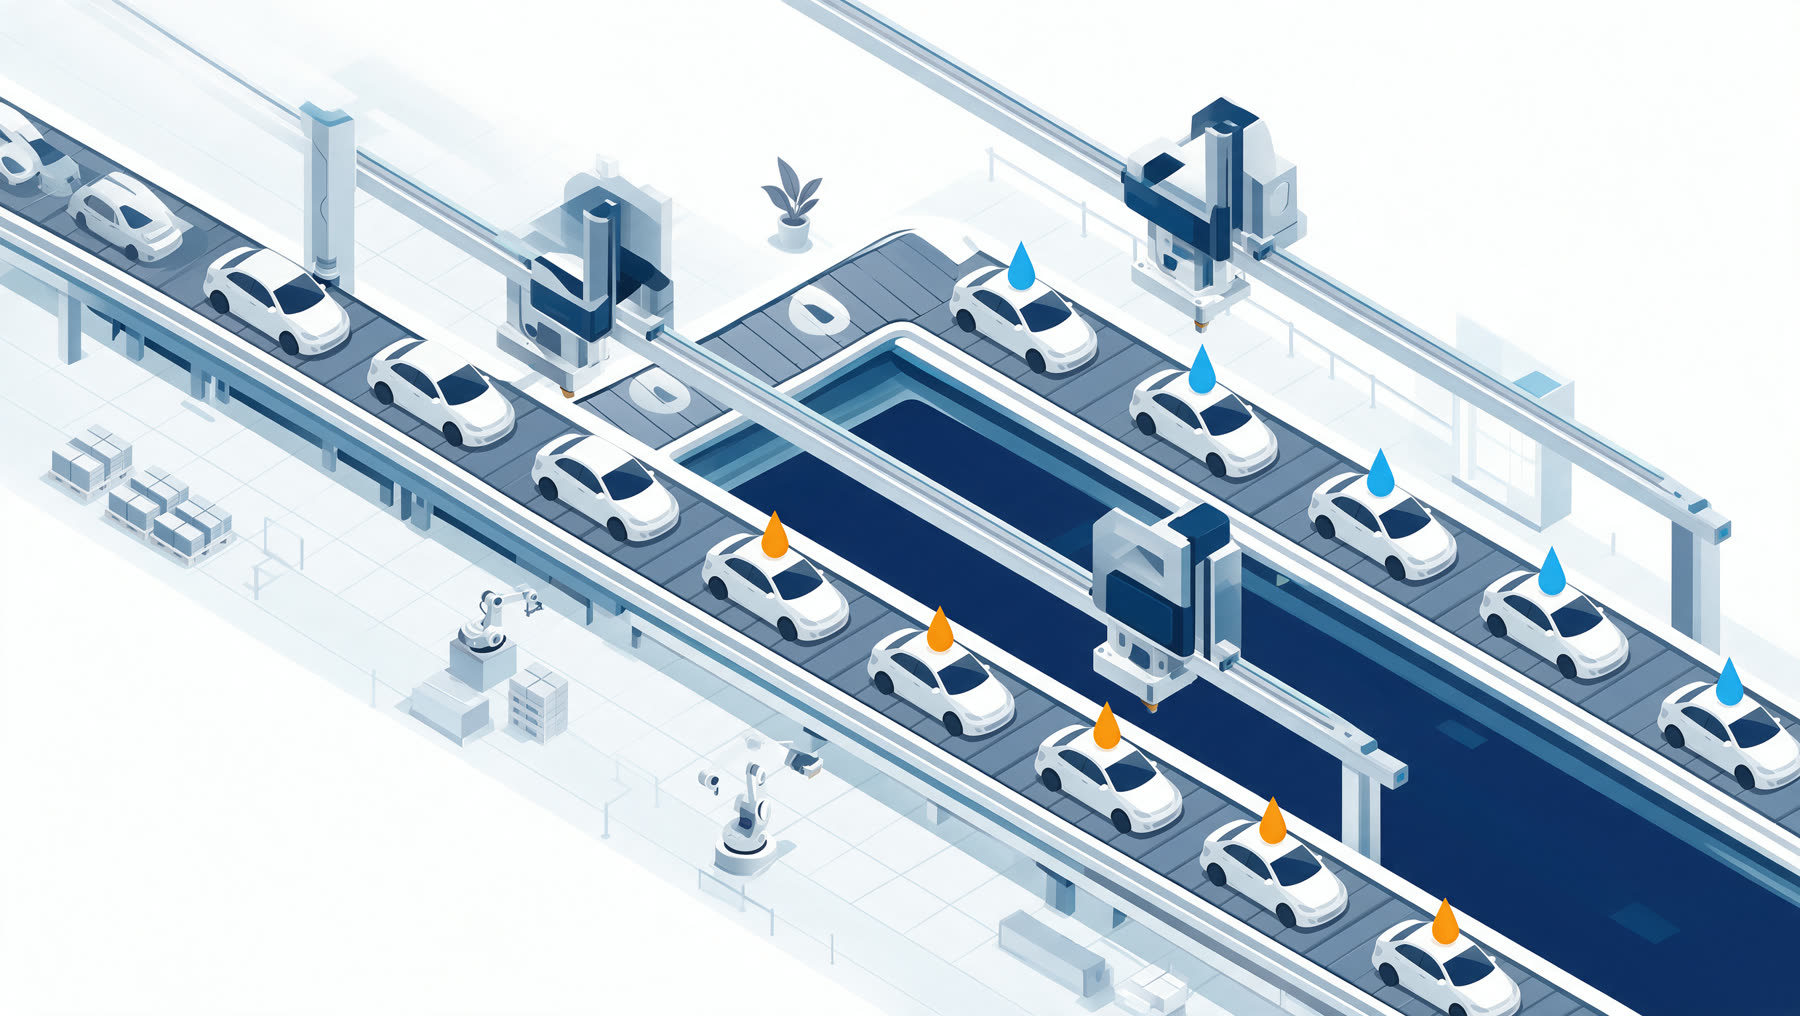
Isometric technical illustration of a production line
Technical illustrationA system drawn as a system

Isometric line work in a locked palette — the right drawing type for machines, supply chains and process. Rendered without a single word baked in, so the labelling stays editable.
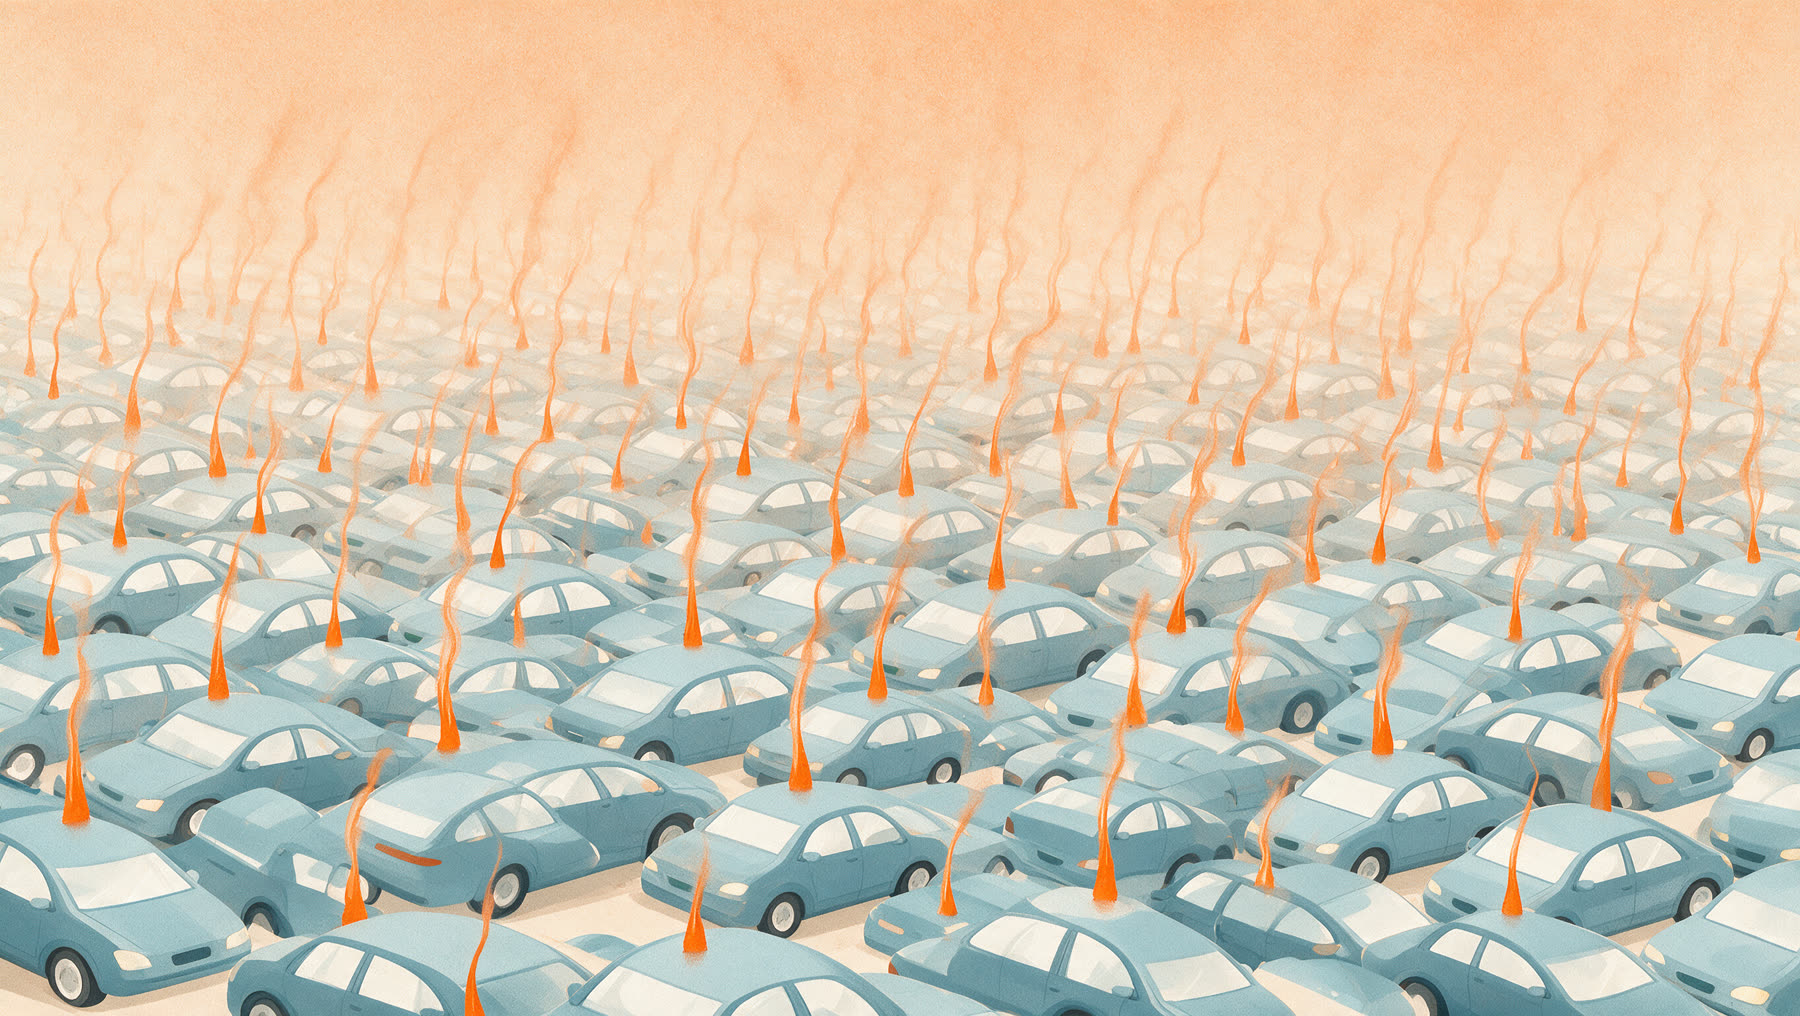
Editorial illustration of a large vehicle fleet
Editorial illustrationScale you can feel

Where a number is too big to picture, the illustration does the arguing. Textured, editorial, and deliberately unlike stock imagery.
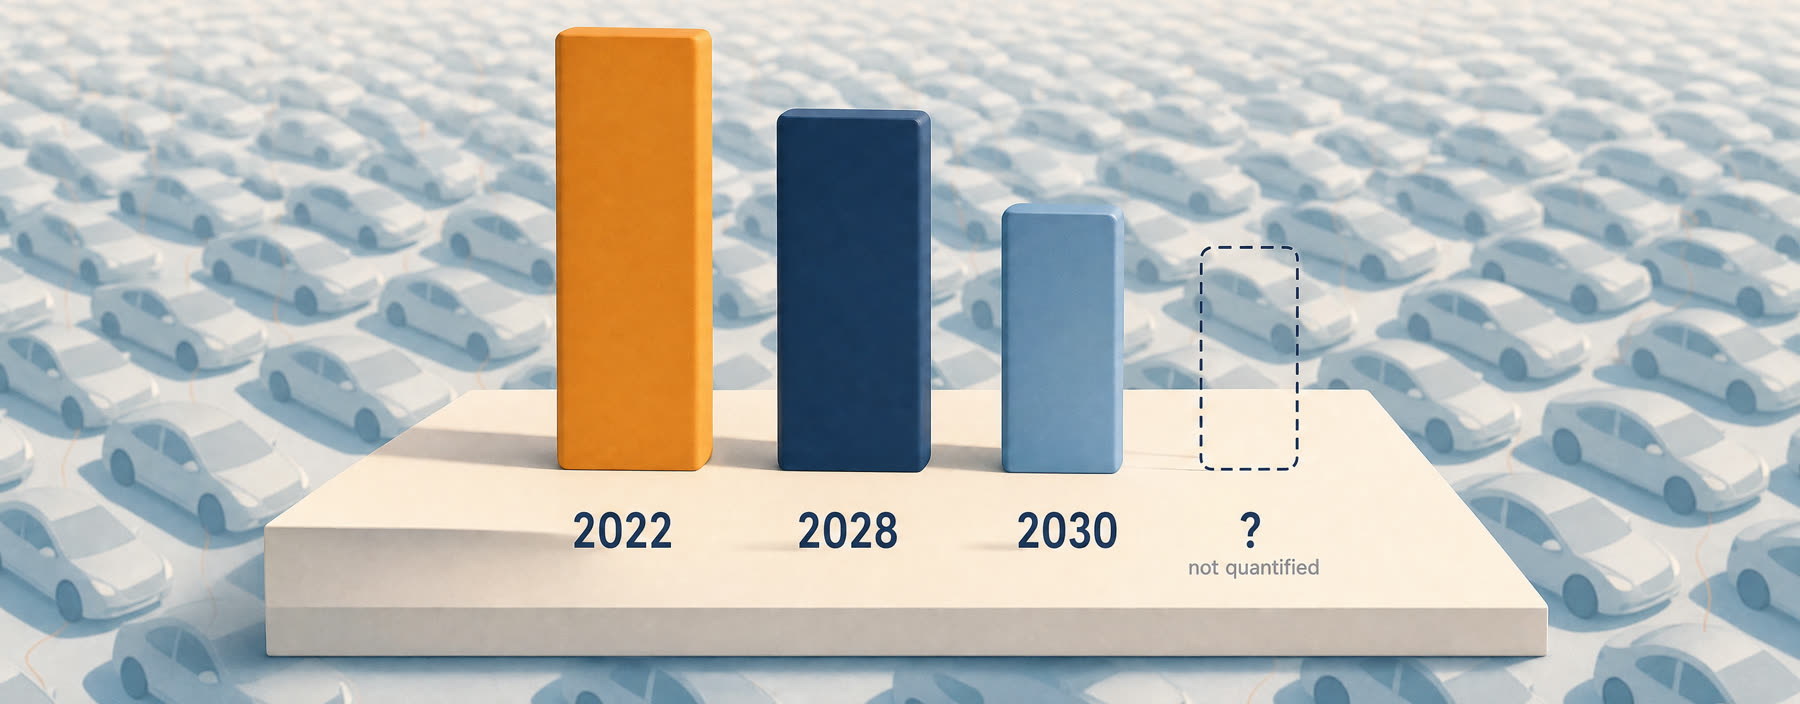
Three-dimensional bar chart data visualisation
Data visualisationCharts that survive a boardroom

Real series, rendered as objects in the scene rather than a flat graph pasted over it — including the honest gap where the data simply doesn't exist yet. Every value is code-laid from the source, never generated.

01House style, locked

Palette, drawing type and typography fixed once, then every asset is produced inside it.

02Facts laid in code

The model never renders a number. Figures and citations are placed afterwards, from the source.

03Motion or still

The same frames run as a static explainer, a social cut-down or a narrated film.

04Yours to re-cut

Versioned source, so a figure can change next quarter without starting again.

Let's talk

Your system, and the campaign around it.

Tell us what you need explained, sold or launched — we'll show you what the finished thing would look like before you commit to it.